Lots of fiction, in all forms, focuses on the world of spying and espionage. There are thousands of books, films, and games that cover the subject, and from different angles. There are non-fiction books and documentaries that study the true history of the subject, romantic fiction, and all sorts in-between.
The most common stereotype among these is probably that of the action packed adventure: fast cars, gunfights, doomsday weapons. James Bond, Jason Bourne, Jack Ryan, all rush from danger to danger in exotic locales across the world.
Then there's another favourite subject of fiction and documentary: police procedurals, murder mysteries, true crime. FBI agents, police inspectors, and complete novices crack mysteries, piece together clues, and the mystery concludes with a dramatic gunfight with the villain, in abandoned fortresses, the faces of mount Rushmore, serial killer's basements.
But these are romanticised depictions. Instead, real mysteries are solved by sifting through information and painstakingly building a picture of the relationships between people and events. The same with espionage, more damage can be done by poring over serial numbershttps://www.numberphile.com/videos/clever-way-to-count-tanks than with silenced pistols.
This is the idea behind "A Hand with Many Fingers"https://store.steampowered.com/app/1229030/A_Hand_With_Many_Fingers/ , a game that is inspired by another genre trope. It's a scene found in several places in espionage/mystery genre: the detective/spy is stumped and has no leads. Or they've pissed off their bosses by overstepping a line. Either way, they're relegated to the basement archives to hunt for clues the hard way: poring through documents. Here's Rust Cohle at it, in True Detective.

There's often a corkboard and red string involved, and after a montage of looking tired, papercopying files and drinking coffee out of polystyrene cups, the hero is rewarded by a new connection. This is a plot device used to take a break from the action, act as an ordeal and Apotheosis in a character arc, to move the plot forward.
In "A Hand with Many Fingers" the premise is this: you are an un-named, un-described individual in the employ of an implied but undefined government agency (FBI?). You are granted a corkboard, some filing cabinets, and a basement archive store with hundreds of files.

You start with a single newspaper cutting: the death of a man in Australia by the name of Nugan Hand. From this single piece of information, and the archive files, you use the corkboard to unravel the connections and events surrounding Hand. You don't know what you're going to find, maybe you will discover the truth behind his death, or something else entirely. From a suspicious death, you trace Hand's connections, and it becomes apparent that Hand was closely linked to schemes such as Air America https://en.wikipedia.org/wiki/Air_America_(airline) , was close friends with a former CIA director, and the story turns from an isolated death to global geopolitics, history, and espionage.
The game's mechanics are also pleasingly simple. You start from the one newspaper clipping. You can use information from that to extract a triplet of name, year, and country of interest. You then use this to consult the filing cabinets. There's a bank of cabinets for each region of the world, a drawer per-year, and an alphabetical list of names in each drawer.

You go to the drawers, lookup the information by year and name, and are given a card with several numbers on it. The numbers are in turn the numbers of boxes, stored in the basement. You trundle down to the basement, retrieve the numbered boxes and examine the contents. The contents will be more newspaper clippings, or redacted intelligence reports, or torn bank statements. These may reveal more dates, names, and places, and you continue the hunt. On your corkboard you can pin these clippings, and draw pleasing red strings between them to show connections.
Slowly you build a network of connections, and begin to understand the relationships between the key characters, and their shady dealings across Vietnam, Angola, and the middle east. At this point it's worth mentioning that this is based on real events, although official collusion between Nugan Hand Bank and the CIA is disputedWarning: spoilers for the game: https://en.wikipedia.org/wiki/Nugan_Hand_Bank . The characters and events depicted in the game were the real subject of conspiracy, and investigation. Nugan Hand Bank was ultimately found guilty of fraud, money laundering, and funding drug smuggling, but the connections to arms smuggling for the CIA remain unproven allegations.
That method of manually hunting down and cross referencing dates is a great way of drawing you into the conspiracy: you slowly uncover new links and start thinking about new theories as to why characters are really connected. But what if there was another way of solving the mystery? To do this we're going to look at a mathematical technique for analysing information, used by real world spies, investigators, and private surveillance organisations. The technique is Social Network Analysis (SNA). Not "social network" as in social media, alhough there is a very close relationship between the two, but the technique of analysing connections that represent "social" ie human relationships, and "network"s in the sense of groups of people.
Social Network Analysis is an application of graph theory https://en.wikipedia.org/wiki/Graph_theory , which represents data in a Graph. There are Nodes, and edges which link them. These can be used to represent whatever you want, it could be roads between points on a map, abstract mathematical concepts, or in the case of social network analysis: people and the connections between them. In fact social network analysis doesn't just have to be people, it could be countries, political movements, etc. But the theories are mostly applicable to people, or things that act "like" people, such as groups of people.
The beauty of social network analysis is how general purpose it is: it can give fascinating insights into people and behaviour from seemingly nonsensical data. There's no particular question it can answer, but instead, given some input data it will assign "weights" and patterns in the data that a human being can interpret. The algorithms are in fact completely ignorant of the "meaning" of data, the techniques operate purely on numbers, and it's humans that supply the context of input, and the resulting interpretation. This gives incredible flexibility: if your input data shows text messages between people, you can see social structures drawn out and draw conclusions about friendships, and relationships. but if you change that dataset to who speaks to each other in person, you get a different output, and different conclusions.
Introduction to graph theory
Let's start off with a classic example: a graph between characters. We start off with our lists of people, and the strenght of their relationship on a scale from 0-10.
| Character A | Character B | Weight |
|---|---|---|
| Acciaiuoli | Medici | 7 |
| Medici | Barbadori | 8 |
| Medici | Ridolfi | 9 |
| Medici | Tornabuoni | 9 |
| Medici | Albizzi | 9 |
| Medici | Salviati | 8 |
| Castellani | Peruzzi | 6 |
| Castellani | Strozzi | 7 |
| Castellani | Barbadori | 5 |
| Peruzzi | Strozzi | 7 |
| Peruzzi | Bischeri | 6 |
| Strozzi | Ridolfi | 7 |
| Strozzi | Bischeri | 7 |
| Ridolfi | Tornabuoni | 6 |
| Tornabuoni | Guadagni | 7 |
| Albizzi | Ginori | 4 |
| Albizzi | Guadagni | 7 |
| Salviati | Pazzi | 3 |
| Bischeri | Guadagni | 7 |
| Guadagni | Lamberteschi | 5 |
Now we draw a diagram, with lines between characters, if they have a relationship. We've already done some simple network analysis here, just by depicting relationships. Suddenly out of a list of names we have shape and pattern, we can begin to see meaning in this. One of the most common forms of analysis is of "cliques" and "clusters" https://www.oreilly.com/library/view/social-network-analysis/9781449311377/ch04.html (you can find the full version online) . Graphs of real world data are not uniformly distributed, and instead we can in fact make out sub-groups, or clusters. These can be connected, or entirely separate, with no clusters. again, it's up to humans to provide interpretation onto this, but if we take graphs of nodes that represent people, these clusters are likely to show friendships, relationships, families etc.
These can be aligned with other attributes people have, such as politics, religion, nationality, interests, beliefs. Suddenly you can see why spies and companies such as Cambridge Analytica https://en.wikipedia.org/wiki/Cambridge_Analytica#Methods are so interested in the subject, and where all of Meta's profits come from.
Now let's do something else, instead of a simple graph with nodes and edges, let's depict some "weights". Weights are where we assign a value to edges or nodes. Again, this number can represent whatever we want it to. In our example, we'll use the relationship score as our weight for edges. Now let's draw the graph again, and visualise the edge weights by size.
We've got the same graph as before, but there's even more information. Now we can see that not only are characters connected, but some are more connected than others. If we supply our human interpretation to the cold numbers again, we can think of these weights as the strength of a relationship.
CENTRALITY
And now we're going to dive into even more interesting territory: the concept of centrality. CENTRALITYhttps://www.oreilly.com/library/view/social-network-analysis/9781449311377/ch03.html is a function in graph theory that has significant implications in the world of social network analysis. Centrality, as the name implies, is a measure of how "central" a node is. Consider the following graph:
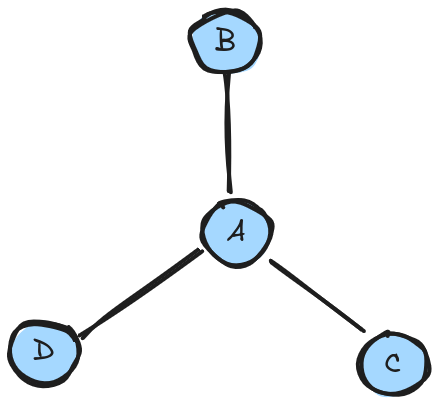
What's the most "central" / important node? clearly the one surrounded by the 3 other nodes: node A. "Important" here is a really vaguely defined concept, and this comes back to the idea earlier: graph theory has no actual knowledge of the "meaning" of data, it just crunches numbers. Importance is a concept superimposed onto these random shapes by people.
In fact in the above diagram there's no indicator as to why any of these nodes in particular is "important" in any real sense, we have no way of knowing what they represent, but we can measure centrality. We could sort of define importance as a synonym for centrality by thinking "How much would it disrupt the graph if this node was removed?". We can see here that if we removed any one of the outside nodes we'd still be left with most of the graph. But the second we remove the centre we no longer have a graph, just some scattered and disconnected dots.
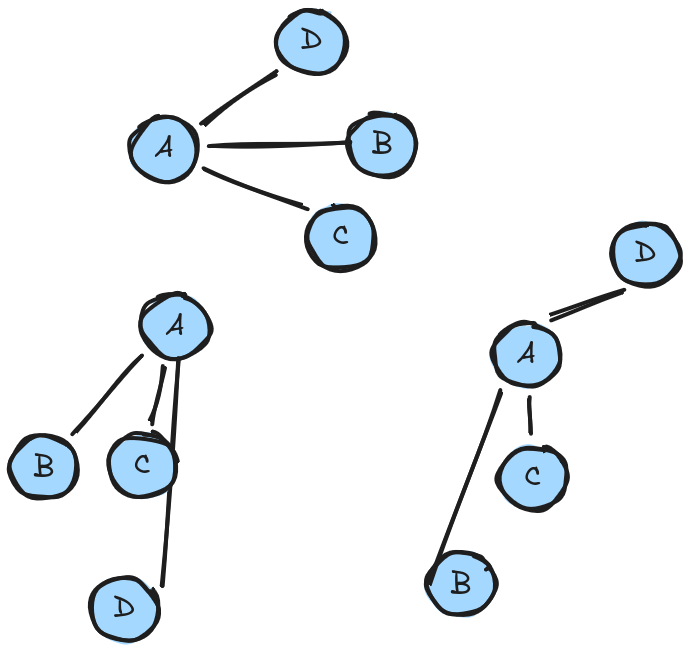
Just to be clear, centrality isn't anything to do with placement or spacing, while we are drawing the nodes here on a 2 dimensional plane, that's just a visual representation to conceptualise the idea: the nodes have no inherent property of x,y coordinates. Node A is still the most "central" to this graph, regardless of how we visually represent it:
Ok, so how is centrality defined? we can see in the examples above, and as humans consider it sort of obvious, but what about a more complex example. What are the centralities of nodes in this graph?
If we go back to our simple example, why was node A the most central? Well if we take each node, and assign it a number based on the number of edges it has, we can see this gives us our result, where the middle node has a centrality of 3, and the others 1:
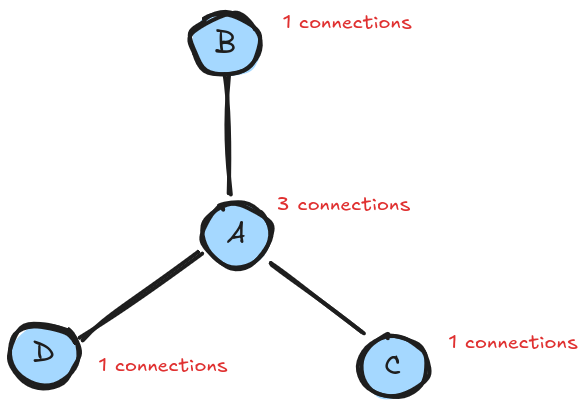
This is the first measure of centrality, known as DEGREE CENTRALITY: the centrality of a node is the number of edges it hashttps://www.sciencedirect.com/topics/computer-science/degree-centrality . This is a pleasingly simple measure, and a building block of other forms. There are other common techniques for assigning centrality, but we'll only look at one: EIGENVECTOR CENTRALITYhttps://en.wikipedia.org/wiki/Eigenvector_centrality . This is probably one of the most commonly used and important measures. The maths is more complex than I really understand, but we can say the way it works is that it takes into account the relative centralities of the neighbours of each node. This means that centrality" flows" through the graph. This results in it disproportionately picking out particular clusters of high importance.
This measure seems to have several impactful consequences in social networks, for example, think about if we use the idea of centrality as an indicator of "importance" or "influence" among people. let's say Alice influences 10 people (10 edges), and Bob also influences 10 people. who's more influential? Degree centrality would say they're equally important. But eigenvector centrality would calculate scores based on the influence that each of Alice or Bob's connections have. If all Bob's friends are nobodies who don't know anyone (they have 0 connections, other than to Bob) then really how much influence does he have? But if all Alice's 10 connections are celebrities and powerful politicians, who in turn influence thousands of other people, then Alice's ultimate influence is greater. EIGENVECTOR centrality would assign Alice a much much higher score than Bob.
We can briefly see the difference between degree and eigenvector centralities in these renderings, showing the exact same data marked using different centrality techniques.
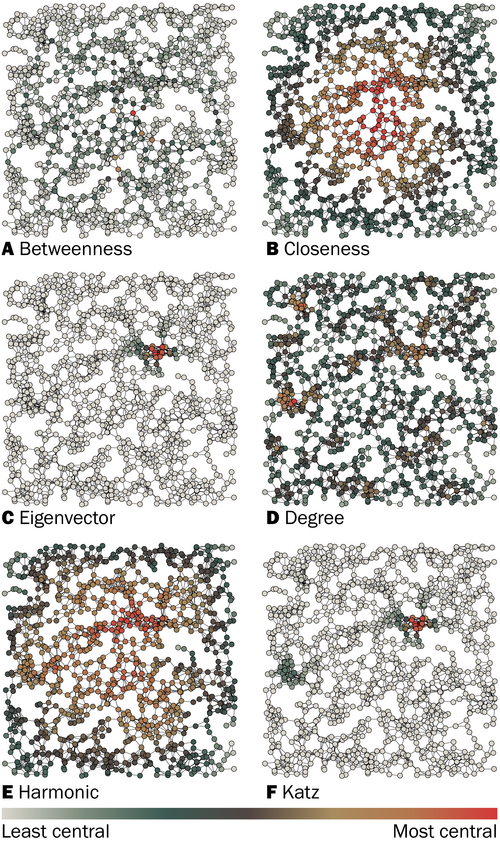
There's no "one" interpretation of centrality when applied to social networks, but we often associate the amount of connections people have with power and influence: think about the phrase "well connected". Maybe it's the number of people who'd lend you money, vote for you, tell you information they shouldn't, but the point is, it's generally regarded as beneficial. So with people we can think of centrality as a measure of social power / influence. In a network representing people, we can often think of high centrality as a representation of leadership, or control of a group. There's a fantastic example (that inspired this post) of showing how social network analysis and centrality could be applied to information from 1775 to identify the ringleader(s) of the American revolution:
- http://euler.nmt.edu/~brian/revere.pdf
- https://kieranhealy.org/blog/archives/2013/06/09/using-metadata-to-find-paul-revere/
If the British counter-revolutionary police had known of this technique then, history might look different. And this shows one of the main uses of SNA: identifying important groups and leadership structures from data. It doesn't take much imagination to work out who's using this and what for.
Before we finish discussing SNA there's something important to point out. Earlier I said the beauty of the idea is that there's no one interpretation of the outcome, the algorithms only input and output numbers, only humans deal in "meaning". There's a flip-side to this as well: as there's no one answer or interpretation of the data, and no way of knowing if the interpretation you've placed on the data is correct. The maths draws connections that might not have any real-world relevance, or the meaning of which is hard to interpret. the connection between a sibling, or a couple look the same to the maths, but we as humans know those are very different types of relationships. Making definitive judgements on the meaning of the data can be hard, and is fraught with risk. It can be tempting to impose simple, pleasing conclusions on the data, and as we know from examples like the birthday paradox, humans are bad at processing probability, and what might sound unlikely can occur much more frequently than we think. In short, jumping to conclusions because SNA makes something appear a certain way isn't a great idea.
Applying Social Network Analysis
Ok, so back from the mathematical sojourn: why do we care about SNA / centrality when it comes to "A Hand with many fingers"? Well if we think about it, the game's central puzzle is this: here's 100 filing cabinet's worth of unstructured data on people, and the player's job is to find the pattern between them.
So what if we take this information, and instead of actually solving the puzzle in-game, just find a way of representing it as a social network, and seeing what the data shows us? Can we use SNA to find the network of people connected to Hand?
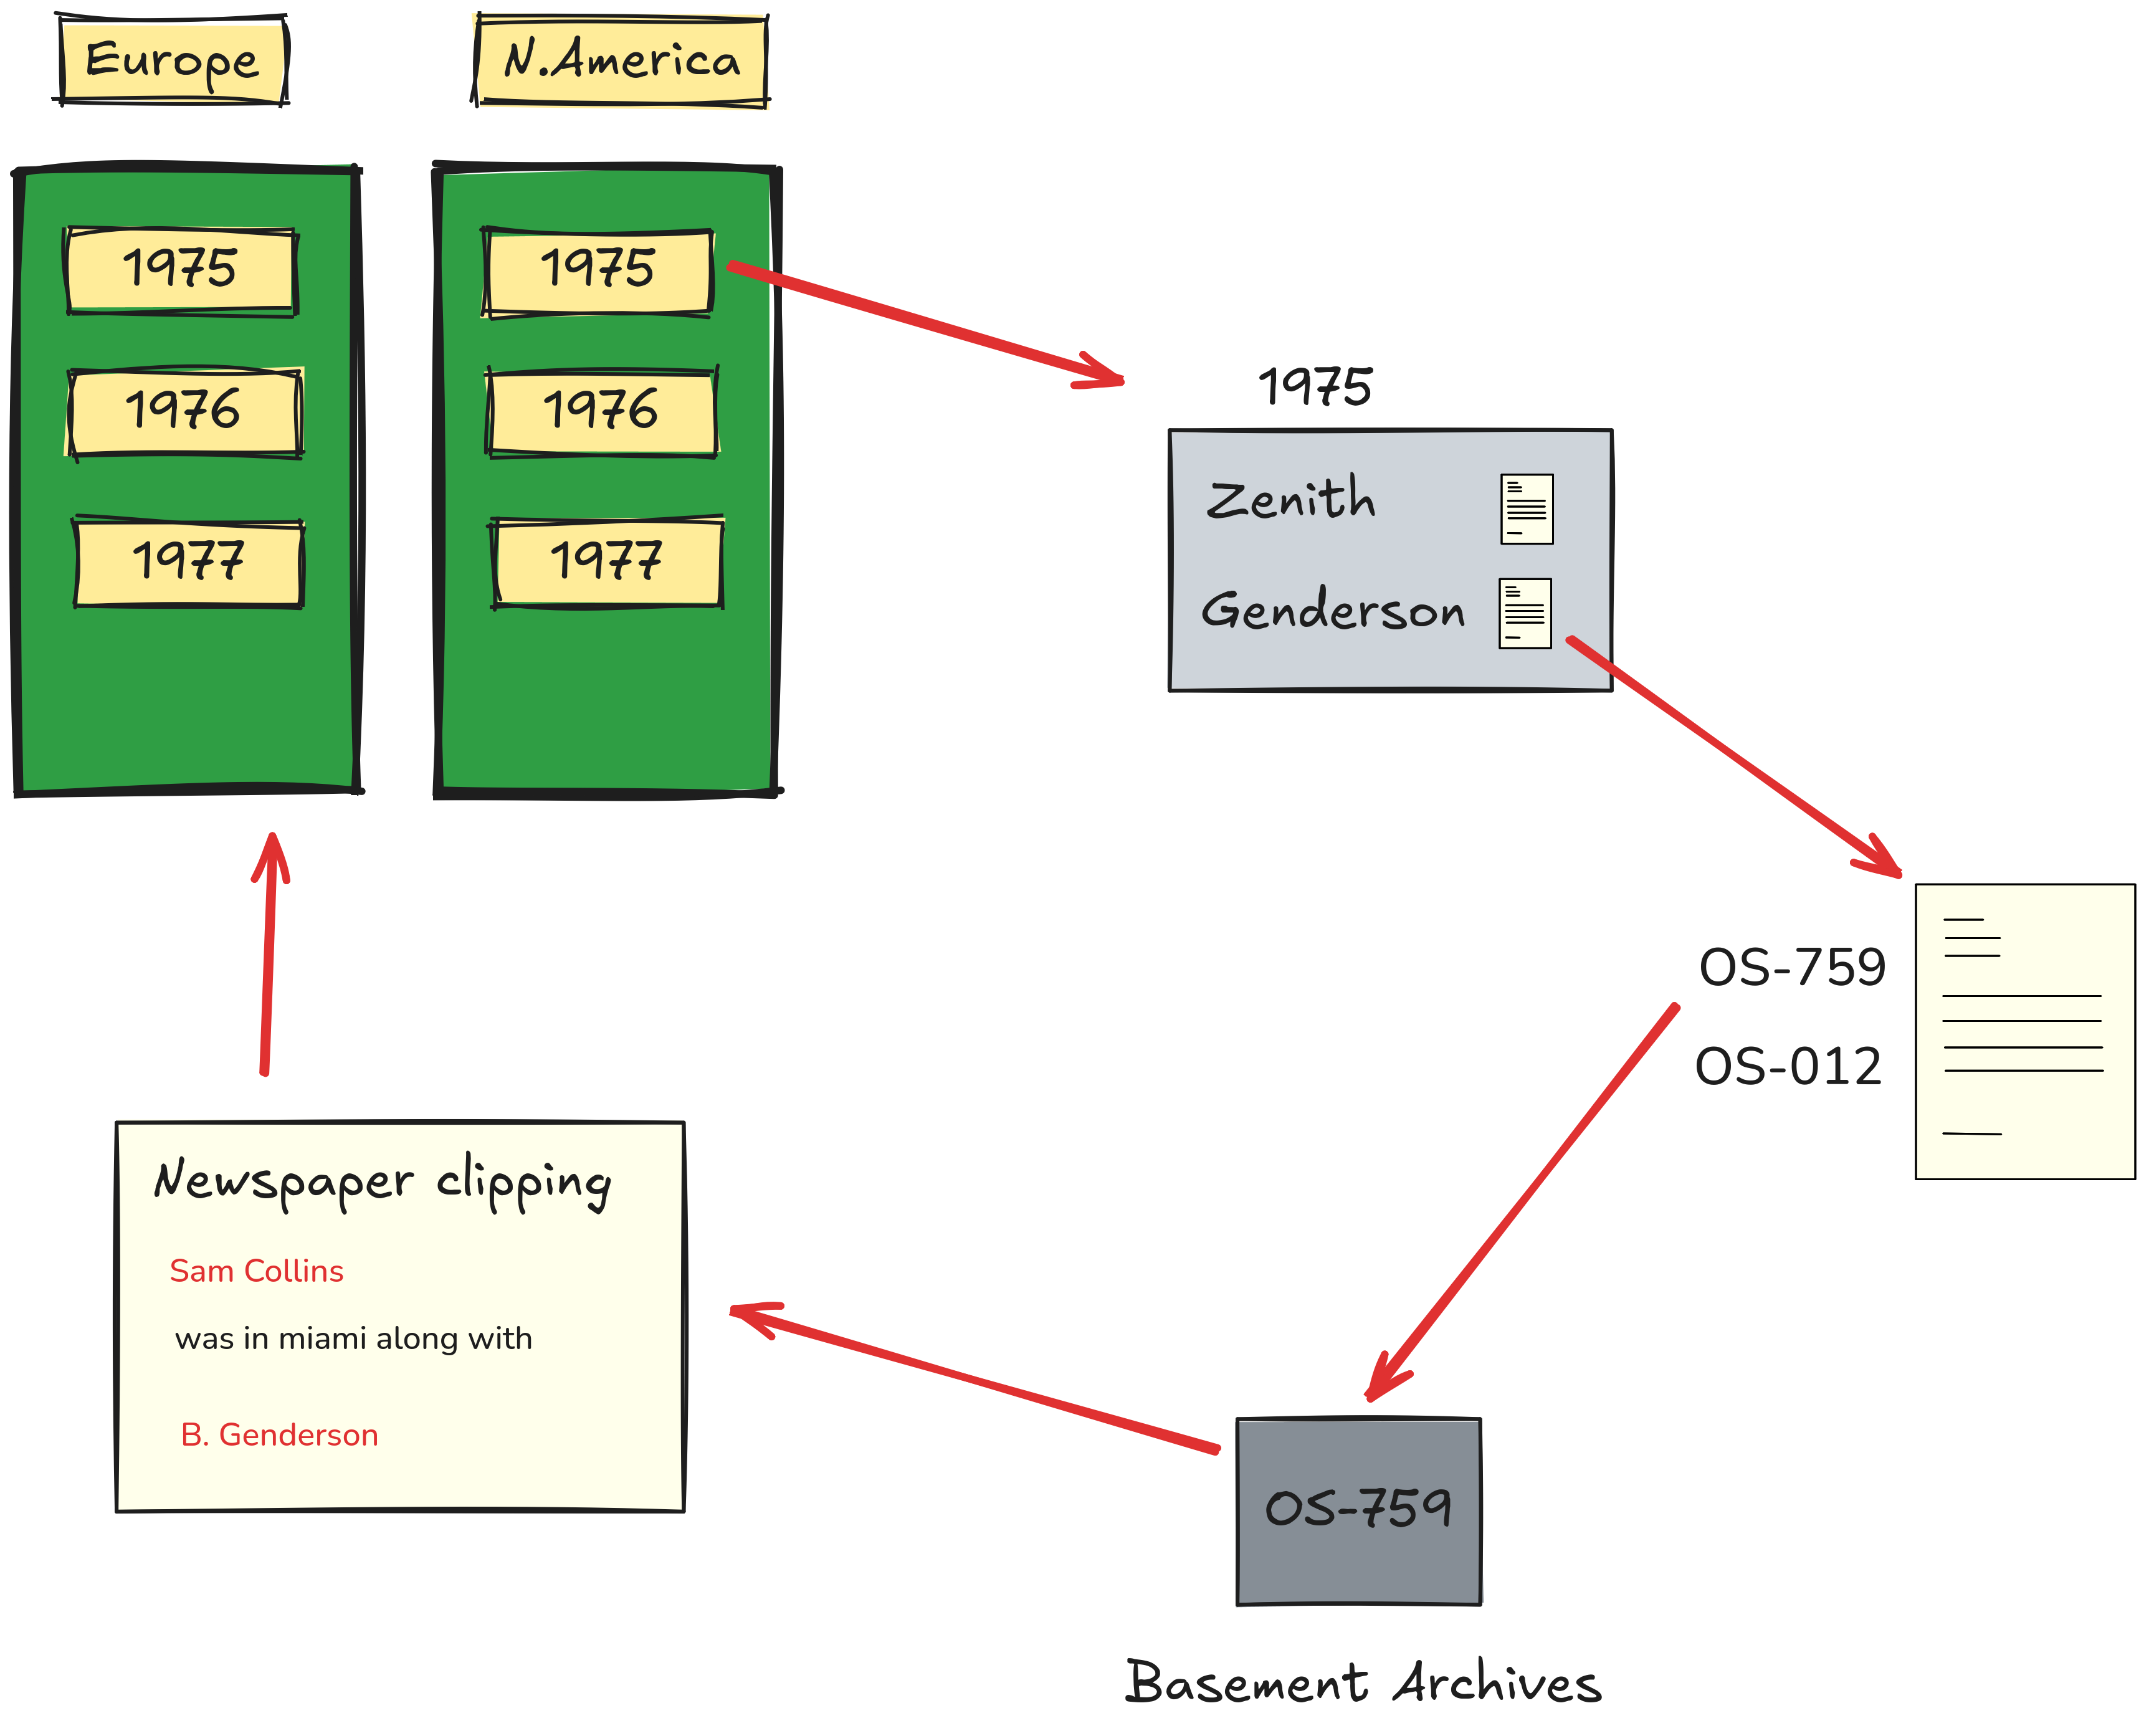
Remember that the game works as follows:
- we have banks of filing cabinets, one per region
- we have a drawer in each bank for each year
- each drawer contains a list of cards with names
- each card has a reference to one or more references to files in the basement archives
As in our earlier examples, we need to pick what our nodes will be. This is simple, each person in the game is represented as a surname on a card index. Now we need to pick relationships, and this is more complex. Several potential definitions immediately come to mind:
- option 1: create a connection between two people if they have been to the same region ever. In the game this means if their names are in the same bank of cabinets.
- option 2: create a connection between two people if they were in the same region in the same year. In the game this means the two names would appear in the same drawer
- option 3: create a connection between two people if they are both referenced in the same file. This would mean both their names share a file index.
Let's dismiss the first: the game has 8 regions, which isn't really a rich enough dataset. We're likely to just end up with a graph that's either just 8 clusters of each region, or just a complete mess. This might tell us who amongst the group is the most frequent traveller, but if 2 people have been to the same region somewhere in a 10 year period, that doesn't mean much, especially considering the regions are often entire continents.
The second, create a connection between two people if they were in the same region in the same year, is immediately more interesting, as it's effectively how you're making connections at the start of the game. You have a newspaper clipping with Hand, Australia, 1979, and start looking for who else was in the region at the same time.
The third is almost better: if two people are mentioned in the same document (news article, photo, bank transfer), chances are there's a real, tangible connection, and our graph should be very powerful as a result.
The last two are almost equally attractive, so let's start with these. But before we can start trying out our theory we have to actually gather the data needed.
Collecting data
I could sit in the game for several hours, and manually copy the data out into a spreadsheet, but that sounds time consuming, so let's cheat. If the information is in the game, it has to exist somewhere in the game's files. So let's use the venerable strings.exehttps://learn.microsoft.com/en-us/sysinternals/downloads/strings to take a peek at the files. The first thing I'm going to do is take the name "ANDERSON" and search in the games files for this data. It's worth pointing out I've changed the name "ANDERSON" from what it is in the game, to not spoil the plot. When we get the data and graph it, I've also switched every name in the game for another, to avoid spoilers (although they're real names, findable on Wikipedia, so go figure...). The reason I didn't use the name "Hand" that we already knew, is that it's only 4 characters, and shows up in the name of the game. Searching for strings less than 5 characters in unsorted binary data is likely to find false positives. To be honest this isn't actually a big problem, but would be on larger files: the likelihood of a completely random 4 byte sequence spelling the ASCII for "Hand" is 1/256^4: 4294967296 a ~ 3GB file (3221225472 bytes) has approximately X% chance of that cropping up. The real reason for not picking "Hand" is that it's in the name of the game, and therefore probably crops up in all sorts of metadata / asset data / class names that we might find in the files.
Anyway, we search for "ANDERSON", and something immediately pops up:
PS > strings.exe -n 10 'A Hand With Many Fingers_Data\level1' | select-string anderson

ME-1978-ANDERSON
AU-1980-ANDERSON
Text-ANDERSONFlights N
BC-ANDERSON
Text-BakerANDERSON1978
Text-WilsonANDERSON1975
Photo-BernieANDERSON N
ANDERSON. B
Fab, this looks exactly like the data we're looking for: we see refereneces to regions (ME = Middle East, AU = australasia), and years. Now just to check, let's search for a random name that's not connected to the plot, to make sure it's there. The name "gentry" should work, their name appears in some files, but has no relevance to the story.
PS > strings.exe -n 10 'A Hand With Many Fingers_Data\level1' | select-string gentry
PS >
Uh-oh. No hits for "gentry" in that file where we found the "anderson" references. This suggests the file we're searching only contains the plot-relvant names. In other words: a name in this file means they appear in the "main story", and if it doesn't, it's a random entity used as filler. This would allow us to work out the main story actors by simply seeing if they exist in this file. That's cool, but if we put ourselves in the shoes of the unnamed detetive in the archive, we wouldn't have this information, and so it's extra-cheatey. Let's keep looking.
The second file that jumps out looks much more promising: This looks exactly like the definition of the filing cabinets, wrapped in JSON.
PS > strings.exe -n 5 'A Hand With Many Fingers_Data\sharedassets1.assets' | select-string gentry

GENTRY
[{"surname":"ABBOTT\r","initial":"E","refs":["OS 654/49","OS
331/91","OS 272/94"]},{"surname":"ADAMS\r","initial":"O","refs":["OS
225/85","OS 472/82","OS
... SNIPPED ...

667/30","OS 682/65"]},{"surname":"ZAMORA","initial":"W","refs":["OS
236/56","OS
314/24"]}]
If we unpick this we get a JSON list with entries such as the following:
{
    "surname": "CARSON\r",
    "initial": "D",
    "refs": [
      "OS 370/8"
    ]
  },
That's a bit confusing, there's no grouping there of "region", or even year, just names and their card index references. So this only gives enough data for method 3: linking two people if they share a card reference. Unforetunately, this has the opposite problem as the first example, this contains every entry except the key characters, so back to the drawing board. At theis point I tried a few more approaches:
- searching for the reference numbers themselves in files, to see if any file contains both story critical and non-critical references. Nope.
- trying to recreate the above JSON structure of the non-story entries found above by recreating data from the
level1file. Unfortunately this is also too hard: the binary structure doesn't seem to keep OS numbers next to story character names, so can't automatically link them. You can see an example of a file opened in a hex editor below showing this - trying to look not in the files, but in the game's memory at runtime, as maybe the data is rearranged at runtime. Nope.
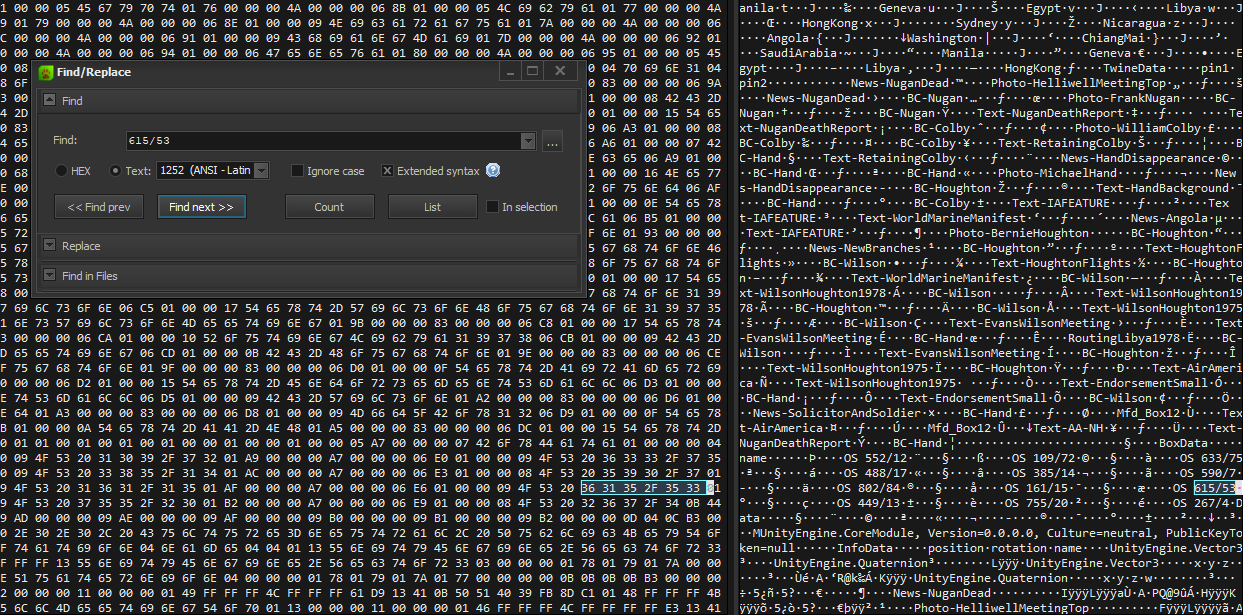
At this point I'm about to give up, and trawl through every filing cabinet in the game to gather the information, but then I found a guide on the steam guides page for the game, that lists the story relevant card entries. For example, we now have information such as Australia 1980 - Hand: OS 633/75, OS 385/14. I'll adapt this to be a mapping between (sur)names and OS numbers, and we get:
Hand: [OS 633/75, OS 385/14, OS 385/14, OS 385/14, OS 449/13, OS 385/14, OS 590/7, OS 385/14, OS 449/13
Nugan: OS 109/72, OS 633/75,
Baker: OS 161/15, OS 615/53, OS 449/13, OS 161/15, OS 786/95
REEDER: OS 633/75, OS 802/84, OS 161/15, OS 802/84
Collins: OS 488/17
Martello: OS 267/4, OS 536/84
again, I\'ve obfuscated the original names here
There's a lot of duplication, since each box might contain multiple files, which reference other dates and places, this is the point of an archiving system like this. This doesn't matter for now. Let's store the data as a dict of sets, so we get a key-value mapping names to a list of OS numbers. If we also adapt the non-story examples to this format we should have a good enough datasource to work from:
#!/usr/bin/env python3

import json
import networkx as nx

data_dict = {}

story_data = {
    "HAND": ["OS 633/75", "OS 385/14", "OS 385/14", "OS 385/14", "OS 449/13", "OS 385/14", "OS 590/7", "OS 385/14", "OS 449/13"],
    "NUGAN": ["OS 109/72", "OS 633/75", ],
    "Baker": ["OS 161/15", "OS 615/53", "OS 449/13", "OS 161/15", "OS 786/95"],
    "REEDER": ["OS 633/75", "OS 802/84", "OS 161/15", "OS 802/84"],
    "Collins": ["OS 488/17"],
    "Martello": ["OS 267/4", "OS 536/84"],
}

for name,numbers in story_data.items:
    data_dict[name]: set(numbers)

non_story_data = json.load(open('hand.json', 'r'))

for d in non_story_data:
    if d['surname'] in data_dict:
        data_dict[d['surname']].update([d['refs']])
    else:
        data_dict[d['surname']] = set([d['refs']])

# data_dict now contains all OS refs
Here's some simple python to parse the data, create a graph, caclulating degree and eigenvector centrality, using the networkX library:
#!/usr/bin/env python3

import json
import pandas as pd
import networkx as nx
import matplotlib.pyplot as plt
from bokeh.models import Range1d, Circle, ColumnDataSource, MultiLine, LabelSet, CustomJS
from bokeh.transform import linear_cmap
from bokeh import palettes
from bokeh.io import show, output_file
from bokeh.plotting import figure, from_networkx

def build_centrality_table(G):

    '''
    given a graph G and a centrality metric, return dataframe of node centralities :)
    '''

    try:
        df = pd.DataFrame.from_dict(nx.closeness_centrality(G), orient='index', columns=['closeness_centrality'])
        df = pd.merge(df,pd.DataFrame.from_dict(nx.degree_centrality(G), orient='index', columns=['degree_centrality']), left_index=True, right_index=True)
        df = pd.merge(df,pd.DataFrame.from_dict(nx.eigenvector_centrality(G, max_iter=10000), orient='index', columns=['eigenvector_centrality']), left_index=True, right_index=True)
        df = pd.merge(df,pd.DataFrame.from_dict(nx.katz_centrality(G, max_iter=100000), orient='index', columns=['katz_centrality']), left_index=True, right_index=True)
    except Exception as e:
        print("Unable to calculate centralities")
        #raise e
        empty_centralities = {x:0 for x in G.nodes}
        df = pd.DataFrame.from_dict(empty_centralities, orient='index', columns=['closeness_centrality'])
        df = pd.merge(df,pd.DataFrame.from_dict(empty_centralities, orient='index', columns=['eigenvector_centrality']), left_index=True, right_index=True)
        df = pd.merge(df,pd.DataFrame.from_dict(empty_centralities, orient='index', columns=['katz_centrality']), left_index=True, right_index=True)
        df = pd.merge(df,pd.DataFrame.from_dict(empty_centralities, orient='index', columns=['degree_centrality']), left_index=True, right_index=True)

        # return pn.widgets.DataFrame(pd.DataFrame())

    print(df.sort_values('eigenvector_centrality', ascending=False))

    return df

def render_graph(G, centrality_table, show_labels=True, centrality_measure='degree_centrality'):
    output_file(f"hand_{centrality_measure}.html")
    network_graph = from_networkx(
        G, nx.spring_layout, scale=20, center=(0, 0), weight=1, seed=55)

    try:
        if centrality_measure == 'degree_centrality':

            adjusted_node_size = dict([(node, (degree)) for node, degree in nx.degree(G)])
        else:

            # LOG???
            size = 80
            adjusted_node_size = dict([(node, (value * size)) for node, value in centrality_table[centrality_measure].to_dict().items()])
    except Exception as e:
        print("Unable to calculate centralities")
        raise e


    HOVER_TOOLTIPS = [("Node", "@index")]
    plot = figure(tooltips=HOVER_TOOLTIPS,
                tools="pan,wheel_zoom,save,reset",
                active_scroll='wheel_zoom',
                title='Network',
                width=1000,
                height=700,
                # x_range=(-2, 2), y_range=(-2, 2),
                background_fill_color=None,
                background_fill_alpha=0,
                border_fill_color=None,
                border_fill_alpha=0,
                outline_line_color=None
            )
    plot.xgrid.grid_line_alpha = 0
    plot.ygrid.grid_line_alpha = 0
    if len(adjusted_node_size) > 0:

        nx.set_node_attributes(G, name='size', values=adjusted_node_size)

        size_by_this_attribute = 'adjusted_node_size'

        source = ColumnDataSource(pd.DataFrame.from_dict(
            {k: v for k, v in G.nodes(data=True)}, orient='index'))

        # VARY SIZE VAR BASED ON DIFF MEASURES
        network_graph.node_renderer.data_source = source


        # network_graph.node_renderer.glyph = Circle(radius='size', fill_color=linear_cmap('size', palettes.Spectral[8], min(adjusted_node_size.values()), max(adjusted_node_size.values())))
        network_graph.node_renderer.glyph = Circle(radius=0.3, fill_color=linear_cmap('size', palettes.Spectral[8], min(adjusted_node_size.values()), max(adjusted_node_size.values())))

        plot.renderers.append(network_graph)

        if show_labels == True:
            # Add Labels
            x, y = zip(*network_graph.layout_provider.graph_layout.values())
            node_labels = list(G.nodes())
            source = ColumnDataSource(
                {'x': x, 'y': y, 'cn': [node_labels[i] for i in range(len(x))]})
            labels = LabelSet(x='x', y='y', text='cn', source=source, text_font_size='12px')
            plot.renderers.append(labels)
            callback = CustomJS(args=dict(labels=labels, x_range=plot.x_range), code="""
                const span = x_range.end - x_range.start
                const base = 11
                const scaled = Math.min(30, Math.max(6, base / span * 11))
                labels.text_font_size = scaled + 'px'
            """)

            plot.x_range.js_on_change('start', callback)
            plot.x_range.js_on_change('end', callback)

    return plot

data_dict = {}

story_data = {
    "HAND": ["OS 633/75", "OS 385/14", "OS 385/14", "OS 385/14", "OS 449/13", "OS 385/14", "OS 590/7", "OS 385/14", "OS 449/13"],
    "NUGAN": ["OS 109/72", "OS 633/75", ],
    "WILSON": ["OS 161/15", "OS 615/53", "OS 449/13", "OS 161/15", "OS 786/95"],
    "HOUGHTON": ["OS 633/75", "OS 802/84", "OS 161/15", "OS 802/84"],
    "COLBY": ["OS 488/17"],
    "HELLIWELL": ["OS 267/4", "OS 536/84"],
}

for name,numbers in story_data.items():
    data_dict[name] = set(numbers)

non_story_data = json.load(open('hand.json', 'r'))

for d in non_story_data:
    if d['surname'] in data_dict:
        data_dict[d['surname']].update([d['refs']])
    else:
        data_dict[d['surname']] = set(d['refs'])

# data_dict now contains all OS refs
print(data_dict)

inverse_data_dict = {}
for k,v in data_dict.items():
    for x in v:
        inverse_data_dict.setdefault(x, []).append(k)

G = nx.Graph()
for name,numbers in data_dict.items():
    G.add_node(name)
    for n in numbers:
        for oname in inverse_data_dict[n]:
            if oname != name:
                G.add_edge(name, oname)

# G = nx.fast_gnp_random_graph(1000, 0.01)

df = build_centrality_table(G)
eig_plt = render_graph(G, df, show_labels=True, centrality_measure='eigenvector_centrality')

show(eig_plt)

deg_plt = render_graph(G, df, show_labels=True, centrality_measure='degree_centrality')
show(deg_plt)
If we run this, with no node colourings, we see the shape of the relationships: IMG UNCOLOURED GRAPH
This tells us some interesting things:
- There is a single large, well connected cluster
- There are multiple nodes with 0 or 1 edges, dotted around the edges
- There are a small number of disconnected minor clusters of 4
If we were to apply our theories of Social Network Analysis here we'd say the data shows a single group of well connected associates,with lotsof strange isolated people that don't fit in. This is typically an unusual graph if it were to showreal people / relationships, as we'd typically expect more inerconnectedness, and fewer isolated groups.
Now let's refine our analysis, by calculating centrality scores using DEGREE CENTRALITY, and using this to colour the graph. This should tell us the relative "importance" of certain nodes.Red indicates high centralities, blue low according to the Bokeh "Spectral" palette: https://docs.bokeh.org/en/latest/docs/reference/palettes.html
Now we can see things more clearly, we can see there are a small number of nodes with a high degree centrality (red). We can also see that on the edges of the large cluster are distinct small clusters.
As we can see, this is a kind of confusing analysis: there are no clear winners with high centrality, instead lots of nodes appear to have high centrality. This is what makes degree centrality a less useful metric, especially in Social Network Analysis. What if we calculate eigenvector centrality instead, not degree centrality?
As discussed earlier, eigenvector centrality tends to pick out only the most connected nodes, and we can see this here, as one concentrated "centre" of the graph, coloured with red.
Analysing results
So originally I theorised that we could "solve" the game, by applying Social Network Analysis, and that by calculating centralities of all the characters in the game, we'd be able to find the most influential characters, and solve the mystery.
So did this work?
If the hypothesis was correct, then perhaps the game's main characters are the most well connected / influential people in our archives. If we print out the table, sorted by eigenvector centralities, we'd expect to find the "most influential" characters, and here are the results:
name              closeness_centrality  degree_centrality  eigenvector_centrality  katz_centrality
PAYNE             0.154276           0.028662            4.239510e-01           0.112430
PARK              0.144626           0.025478            3.768897e-01           0.101089
GEYER             0.146413           0.022293            3.678812e-01           0.098157
FULLER            0.148361           0.019108            3.514795e-01           0.092221
OWEN              0.141285           0.019108            3.501144e-01           0.091208
...                  ...                ...                   ...                  ...
NORMAN            0.000000           0.000000            3.576366e-59           0.036707
NYLUND            0.000000           0.000000            3.576366e-59           0.036707
OGILVIE           0.000000           0.000000            3.576366e-59           0.036707
OLIVER            0.000000           0.000000            3.576366e-59           0.036707
XIAO              0.000000           0.000000            3.576366e-59           0.036707
Okay... these aren't the game's main characters, so not the result we might have suspected. Turns out the data doesn't match our hypothesis.
Where are the main characters in our graph? If we look closely we can see they are concentrated in a small cluster by themselves. They're not connected to other parts of the graph, and as a result, not very "central". They don't register at all on our high-centrality list:
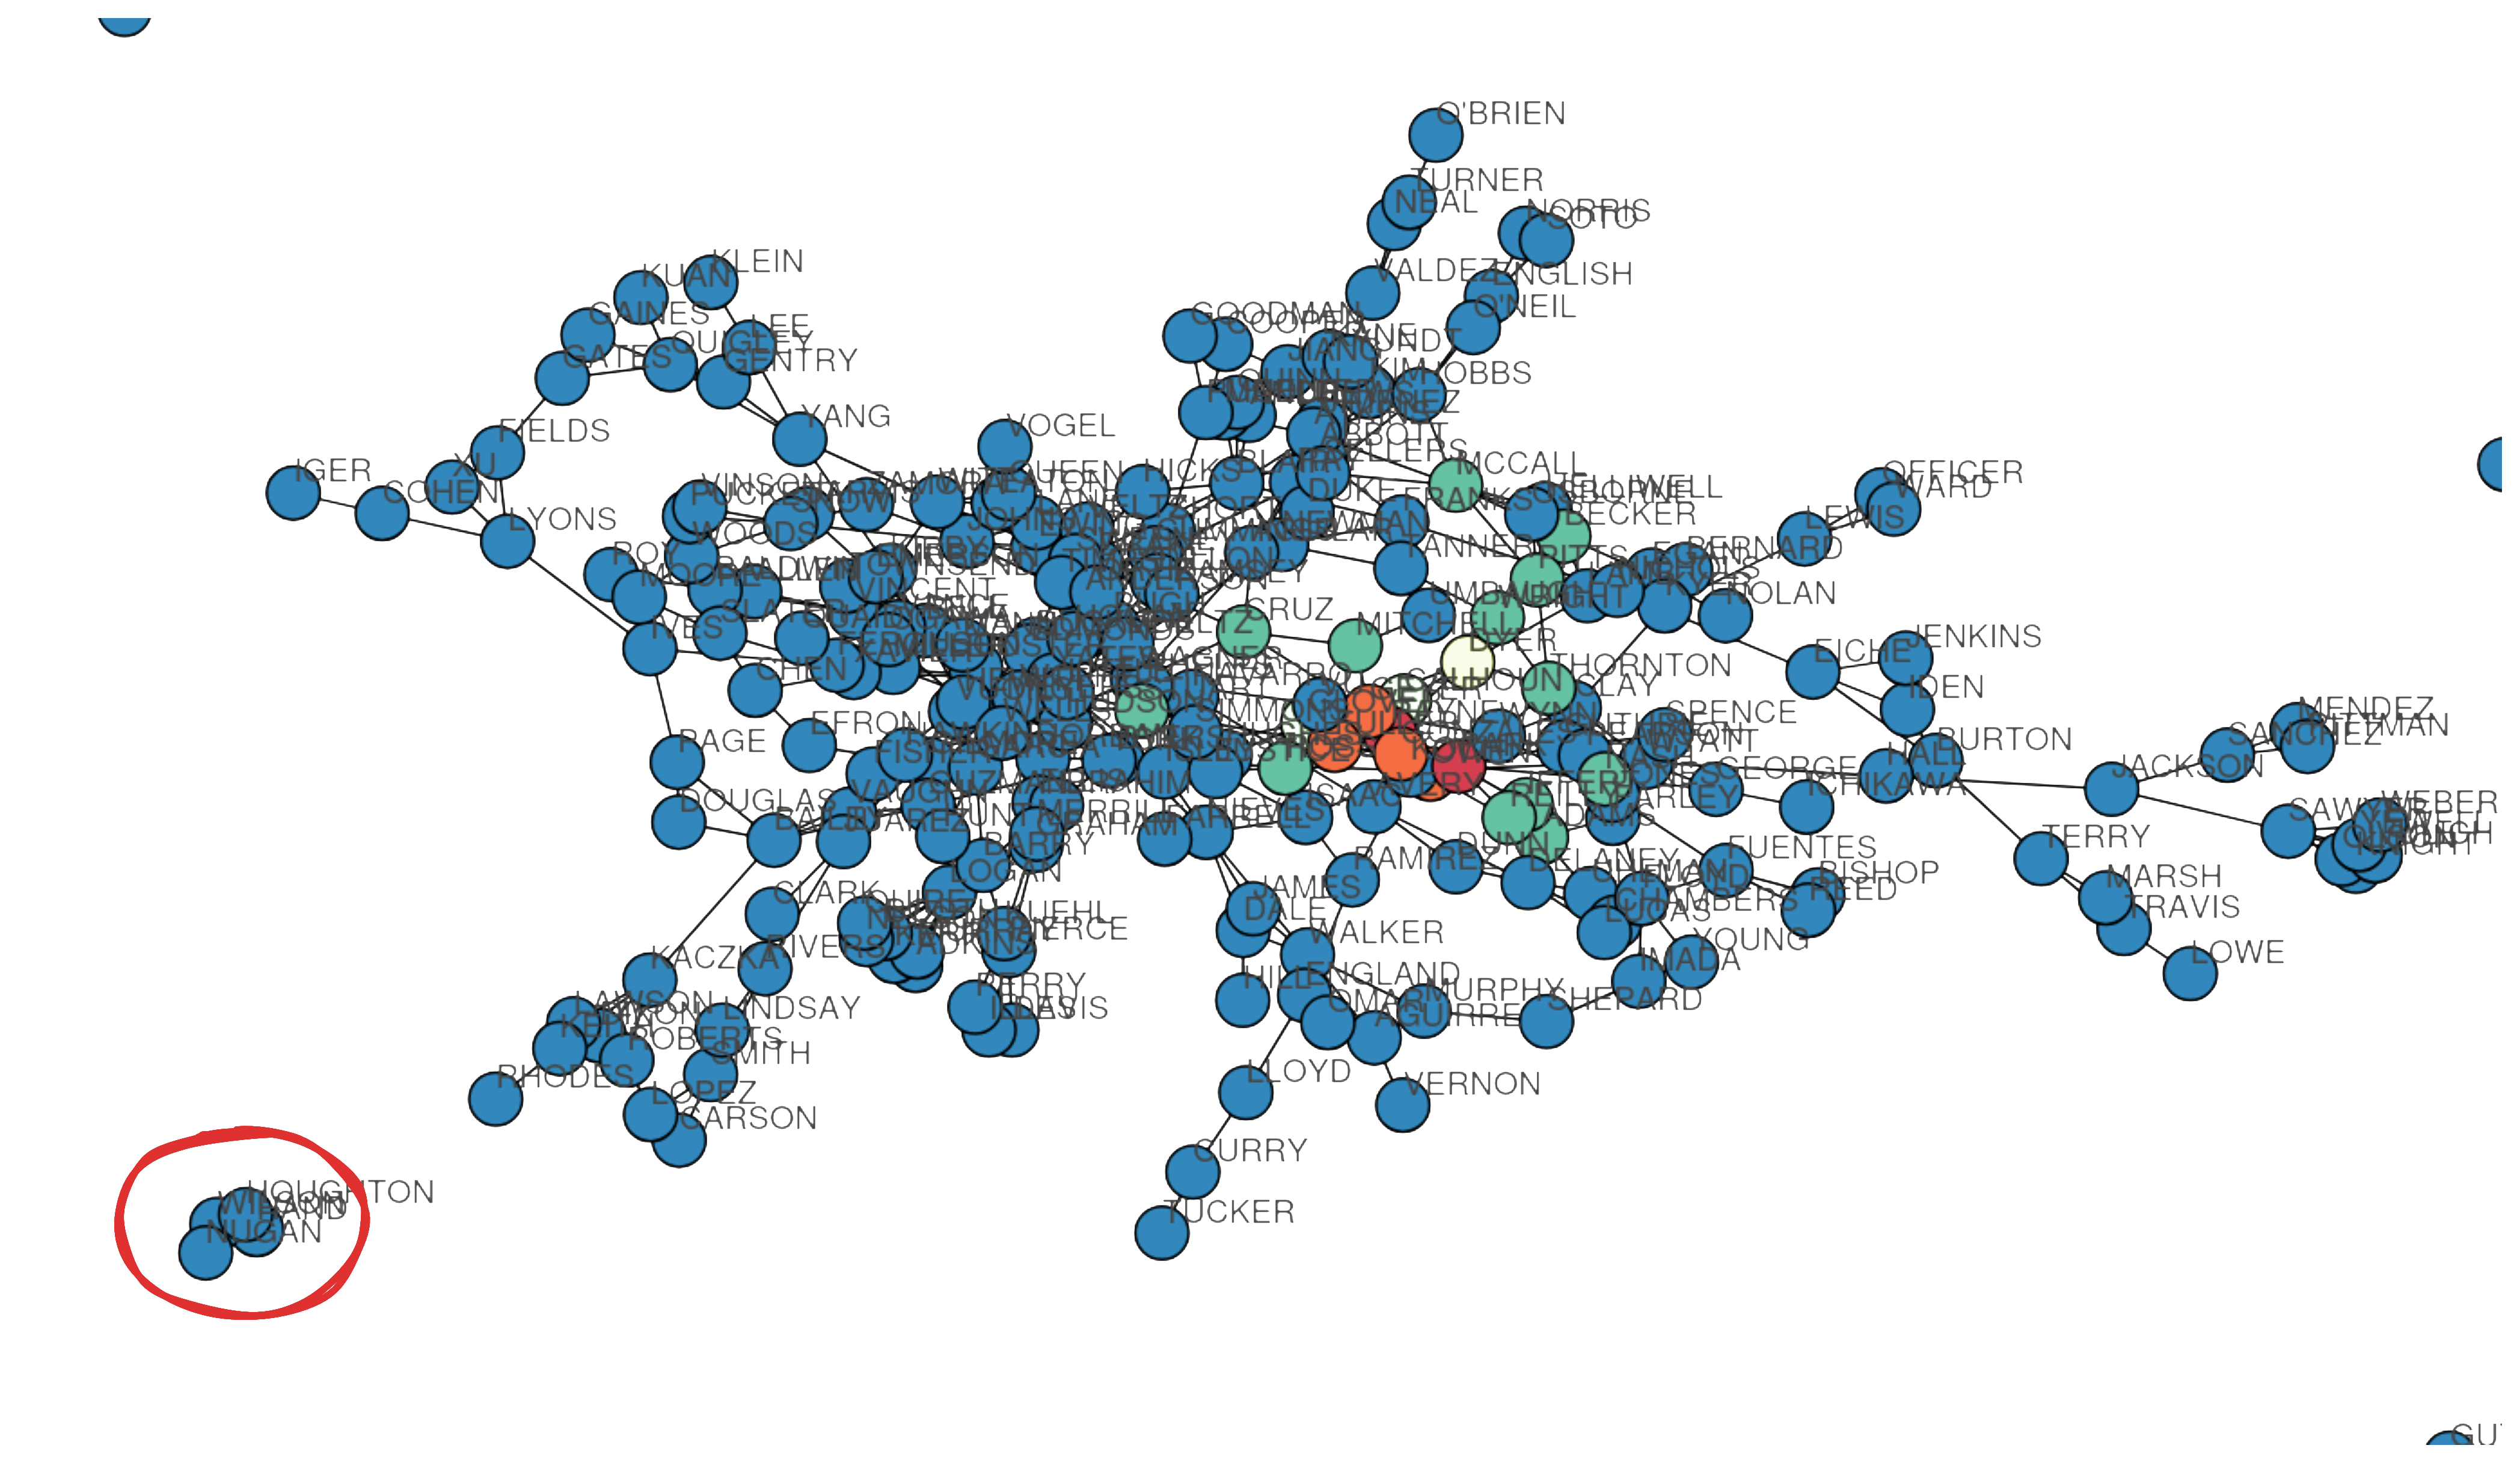 So what does this mean? It means that our characters are differentiated not by their connections, but by their lack of them. It seems an illogical conclusion: we'd assume that these individuals, who ran an international bank, smuggled arms and guns across multiple continents would be extremely "well connected". Why isn't this shown in our analysis?
In a sense the graphing has worked: we've identified the cluster of 4 people closely associated with Nugan, which was sort of our original objective. Except, apparently, this does not include one of the central characters: Collins. Not sure why but I think in the game your supposed to make a leap of faith to work out how hes connected, and he doesn't appear related in any files directly. . Additionally, we can't say that this grouping is really special, as there are multiple other standalone cliques:
- The MONROE-IGUINA-VOSS-LYNCH-TYSON-ESTES-JI cluster
- The KNOX-ELLIOT-IRWIN-KAUFMAN cluster
The reason for this unexpected result, is that this isn't a real dataset.
In fact, if we graph a histogram of the degree centralities, what do we see:
def plot_histogram(df, column='connections', bins=20, output='histogram.html'):
    data = df[column].dropna()

    # Fixed range 0-1 for centrality metrics
    hist, edges = np.histogram(data, bins=bins)

    output_file(output)

    plot = figure(title=f'Distribution of {column}',
                  x_axis_label=column,
                  y_axis_label='Frequency',
                  x_range=(-2, 10),
                  width=800, height=400,
                  tools='pan,wheel_zoom,reset,save',
                  background_fill_color=None,
                    background_fill_alpha=0,
                    border_fill_color=None,
                    border_fill_alpha=0,
                    outline_line_color=None)

    plot.quad(top=hist, bottom=0, left=edges[:-1], right=edges[1:],
              fill_color='steelblue', line_color='black', alpha=0.7)

    show(plot)

df = pd.DataFrame({
    'node': list(G.nodes()),
    'connections': [G.degree(n) for n in G.nodes()]
})

plot_histogram(df, column='connections', bins=30)
But actually this has an interesting real world implication on the biases of social network analysis and other algorithms: data bias in the input will result in bias in the output. In the world of the game, we assume that this archive is a set of data collected independently and without bias. But let's say the collection of newspaper clippings in the game was collected by someone who was actually trying to investigate an unrelated case, would that be unbiased?
it wouldn't contain much Nugan-Hand material, or wouldn't link them to other events.
On the other hand, what if the people responsible for gathering data already knew of Nugan Hand's connection to the CIA and were obsessed with proving it? wouldn't they have disproportinality picked out clippings that support that hypothesis? The resulting data would potentially assign higher centralities to the main cast: the only conclusion that could be drawn from this data is that Nugan hand was connected to the CIA. This is an example of the confirmation/narrative biases that draw people into conspiracy theories every day: you look for a pattern in data, and lo and behold, you find one.
If we'd gathered a completely random set of newspaper clippings, or rather, all the newspaper articles in the world, maybe we'd be able to see other conclusions. This illustrates the real dangers of biased data, and in drawing real world conclusions from social network analysis: the algorithm can only analyse what it knows about, and you have to be very careful to avoid bias in datasets.
Summary
So while ultimately my hypothesis was wrong, and the data wasn't representative of reality , I think this ended up an interesting exploration in network analysis and it's applications.