Intro
This is just a brief summary of some handy Linux tools for keeping an eye on your system, mostly via the commandline. Having easy to view tools helps you quickly check up on performance, with less typing.
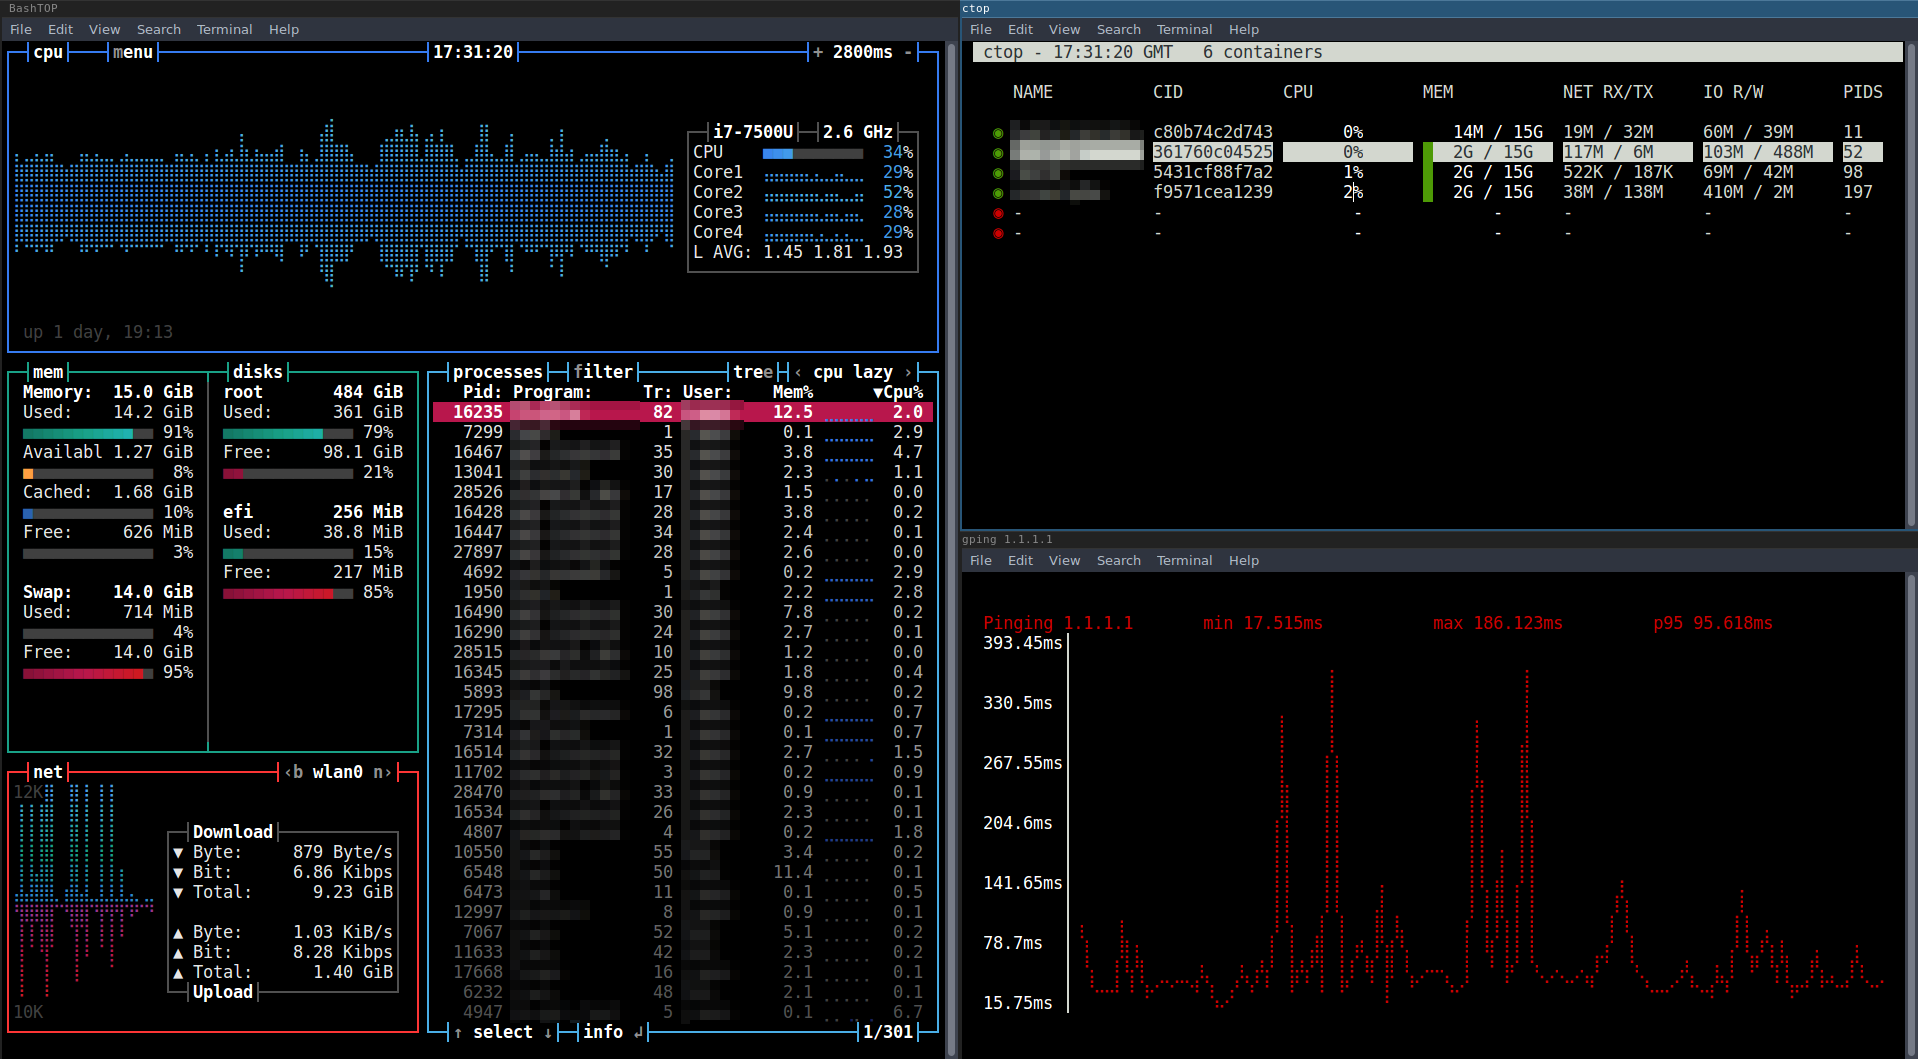
I like to arrange several of these in a display using i3: https://github.com/Jrhenderson11/dashboard, and quickly launch it with a shortcut, then I can hop over to that i3 window and check system status.
alias dashboard='/tools/dashboard/dashboard.sh'
For more pretty CLI utilities check out these lists:
Tools
Networks
Gping is great for monitoring network performance: it graphs ICMP response time by constantly sending ping probes to destinations of your choice. This can show you when networking's completely failed, or just having some temporary disturbances. I pretty much have this on in the background at all times to check connectivity.
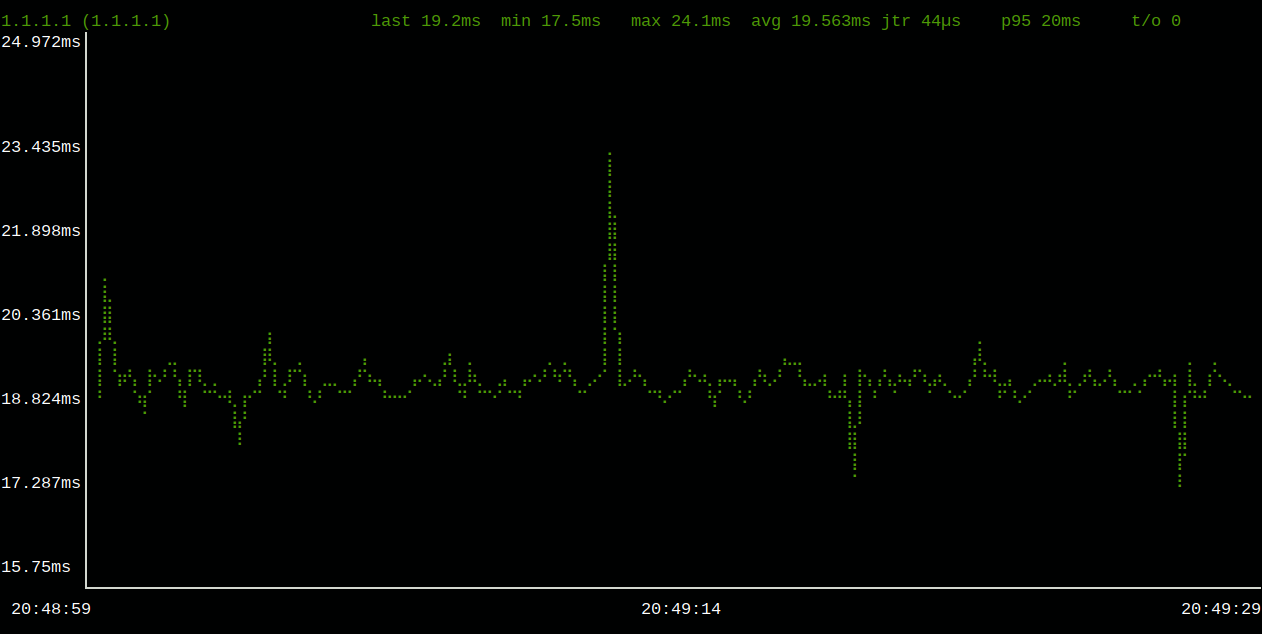
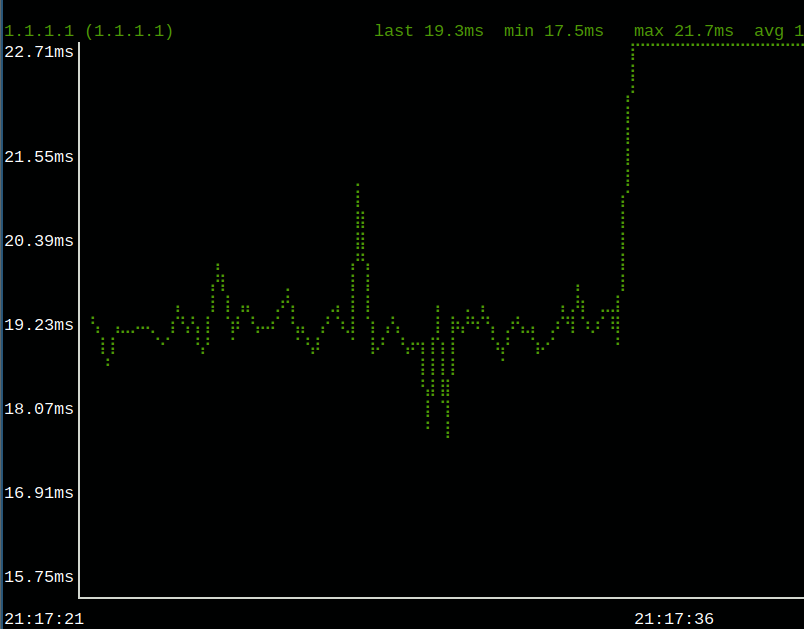
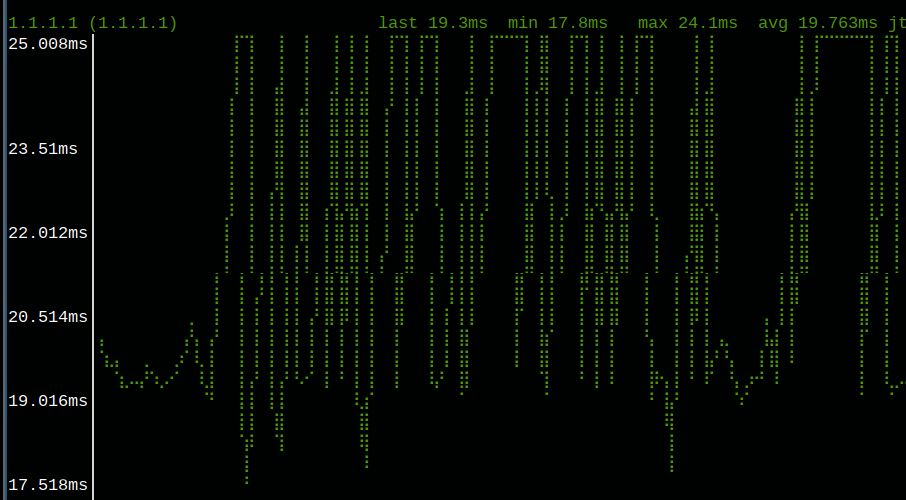 Here I simulated problematic traffic using [qdiscs](https://access.redhat.com/documentation/en-us/red_hat_enterprise_linux/8/html/configuring_and_managing_networking/linux-traffic-control_configuring-and-managing-networking) : `sudo tc qdisc add dev wlp4s0 root netem loss 50%`
Counter-clockwise from top:
1: Normal network behaviour
2: Flatlined network, indicating serious issues (no network):
3: Temporary flatlining, indicating some intermittent Wi-Fi / VPN issues:
Termshark is a beautiful wireshark / tshark TUI alternative for in depth network debugging in a terminal. If you know what you're looking for and just want to record / analyse traffic, then tcpdump / tshark are probably better, but termshark allows more interactive querying in real-time.
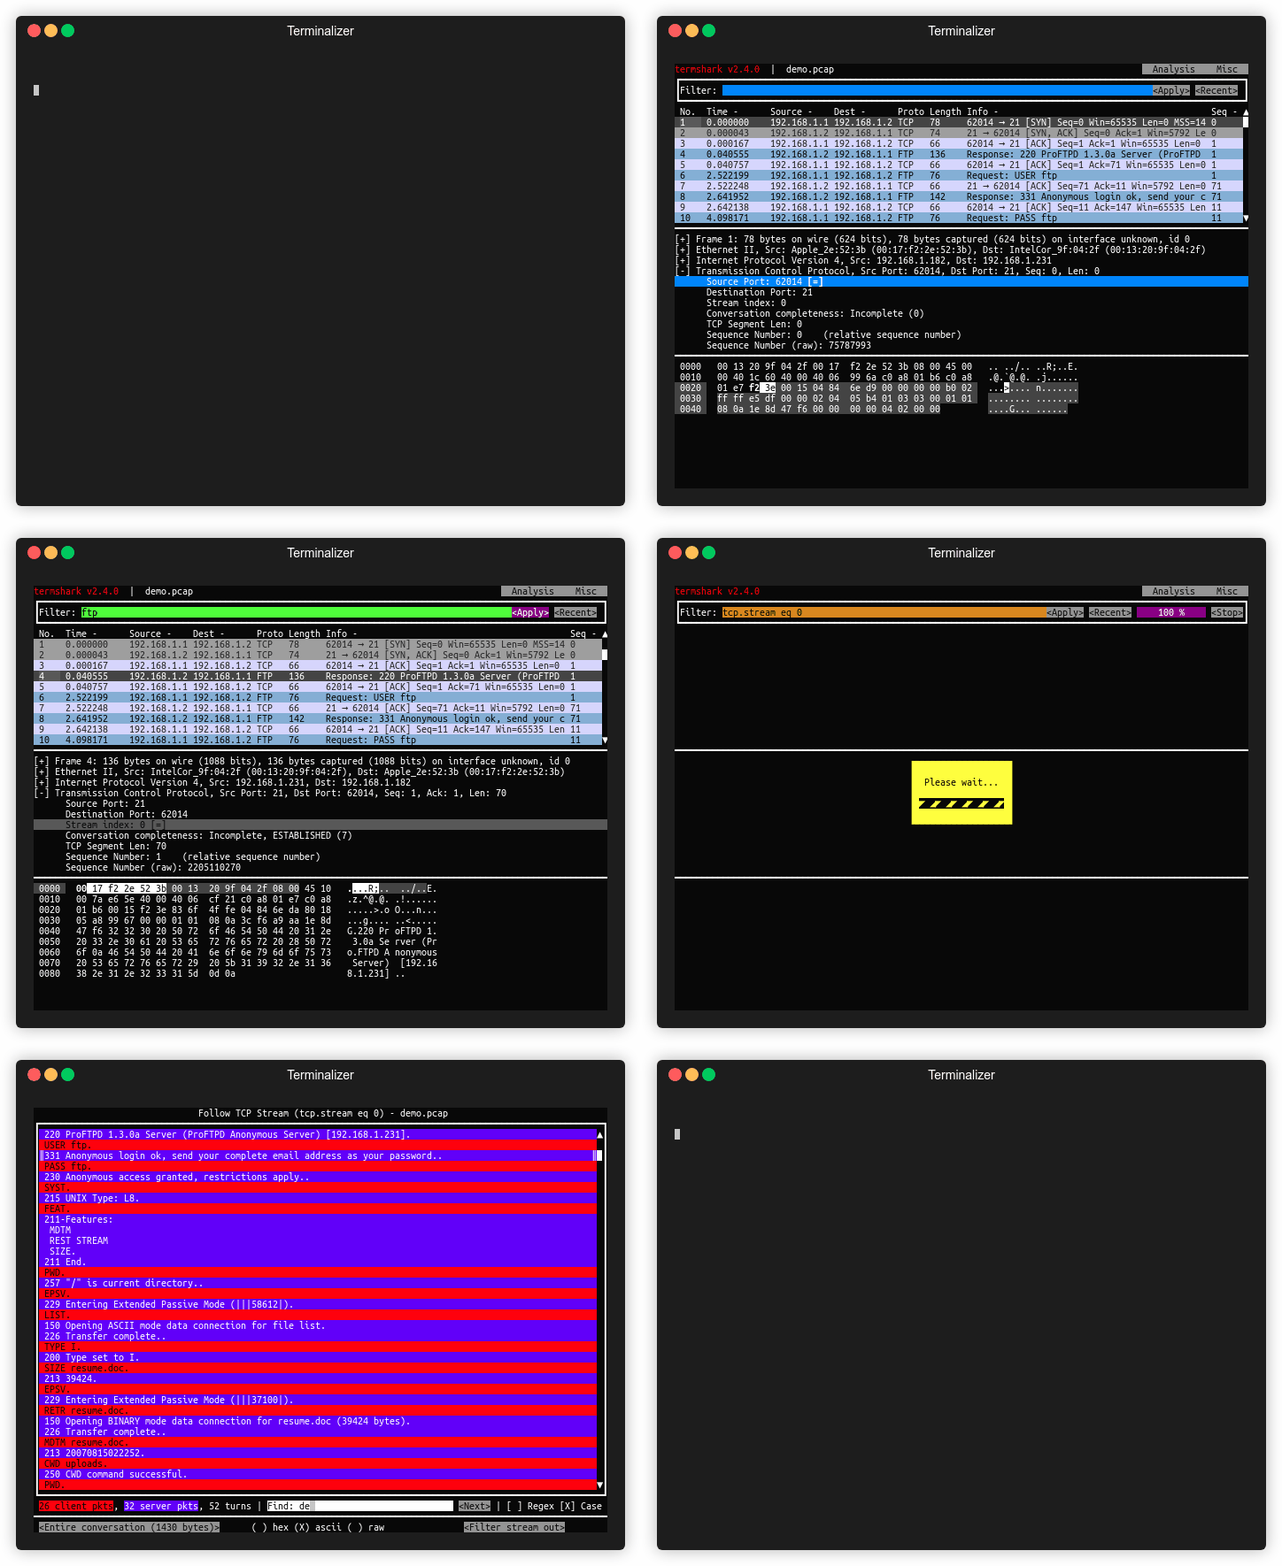
For proxying, mitm_tool now provides an excellent TUI view, that's much more lightweight for quickly checking outgoing traffic than something like Burp / caidoAnd from my playing around caido is quite feature lacking atm
Performance
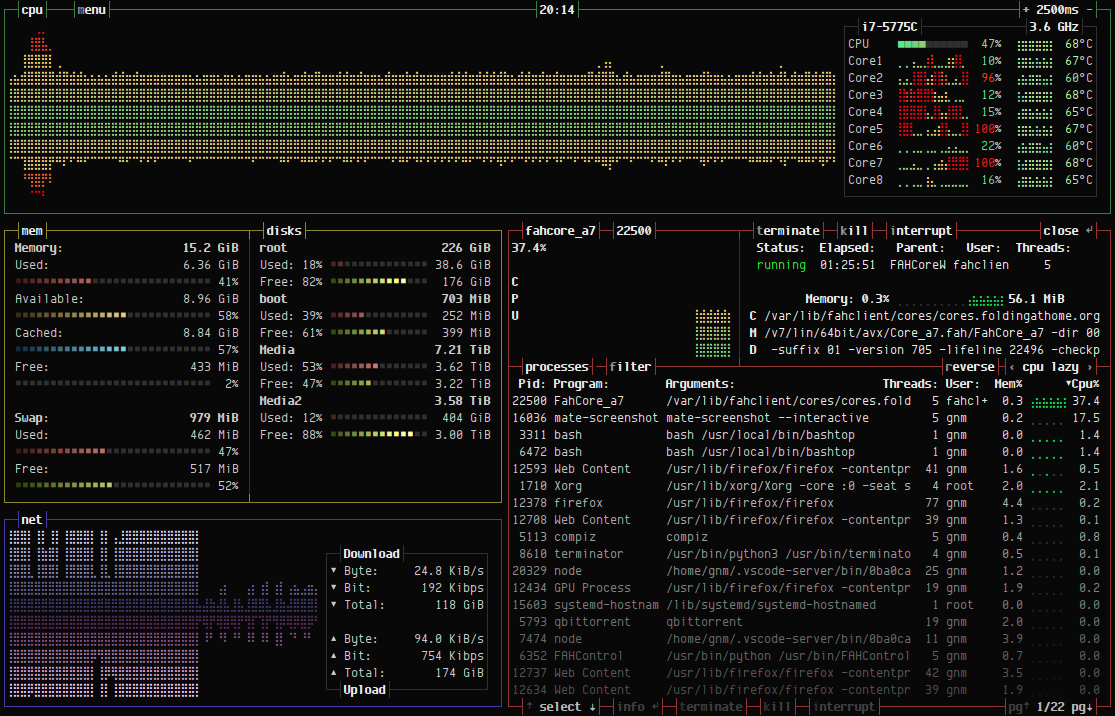
Bashtop is a fantasitc TUI based top replacement, showing CPU, memory, and process details:
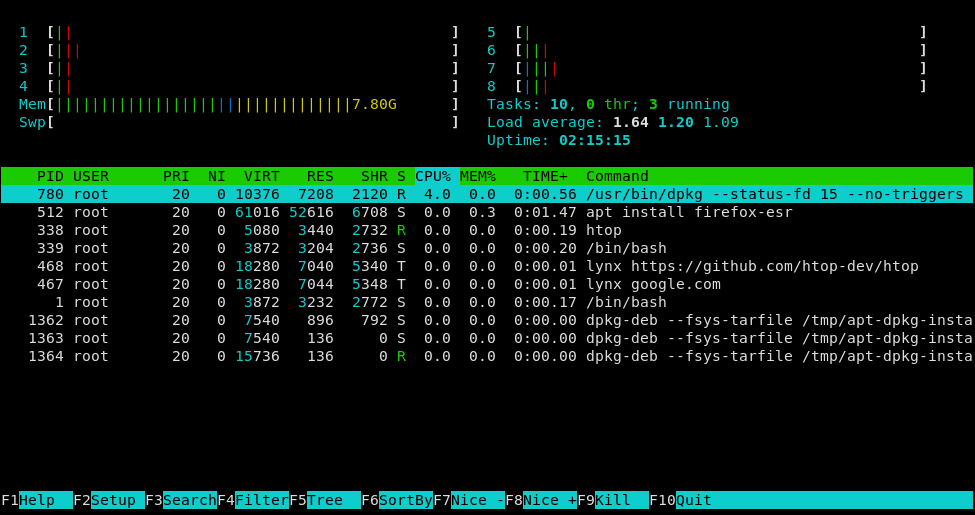
htop is less fully featured than bashtop, but more reliable and with less overhead.
Processes etc.
EBF has brought in some great CLI debugging tools. Some of the most useful can be found in the bcc tools repo:
-
Execsnoopsimply show executed programs, super useful for finding -
Opensnoopshows opened files / directories -
TCPtopis like a live netstat display -
bindsnoop/TCPTracer/tcpconnecttrace new listening / outgoing TCP conections -
tcplifeTraces connection time, useful for diagnosing slow connections -
Traceuses userspace EBPF functions -
sslsniffhooks well known TLS calls (openssl, GNUTLS, NSS) to read plaintext TLS traffic.only applies to dynamically linked programs
You can also quite simply expand the simple TODO tool to construct your own traces, if you want to look for specific properties
Disk
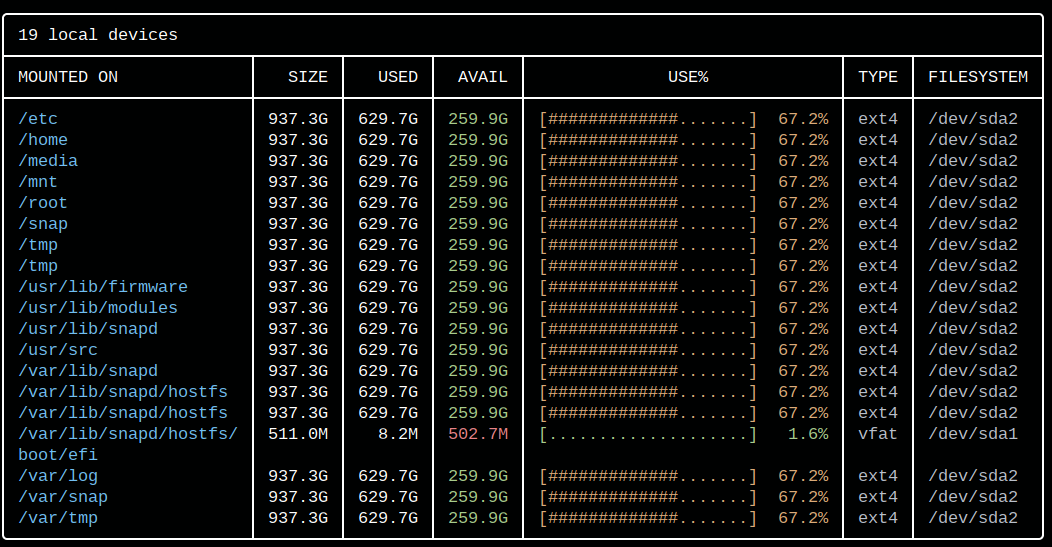
duf is an upgrade to df. A nice breakdown of disk usage per partition, slightly easier to parse at a glance thanks to the formatting. To filter out pseudo filesystems and annoying snap disks on Ubuntu I use the following alias:
duf='duf -hide fuse,special,loops'
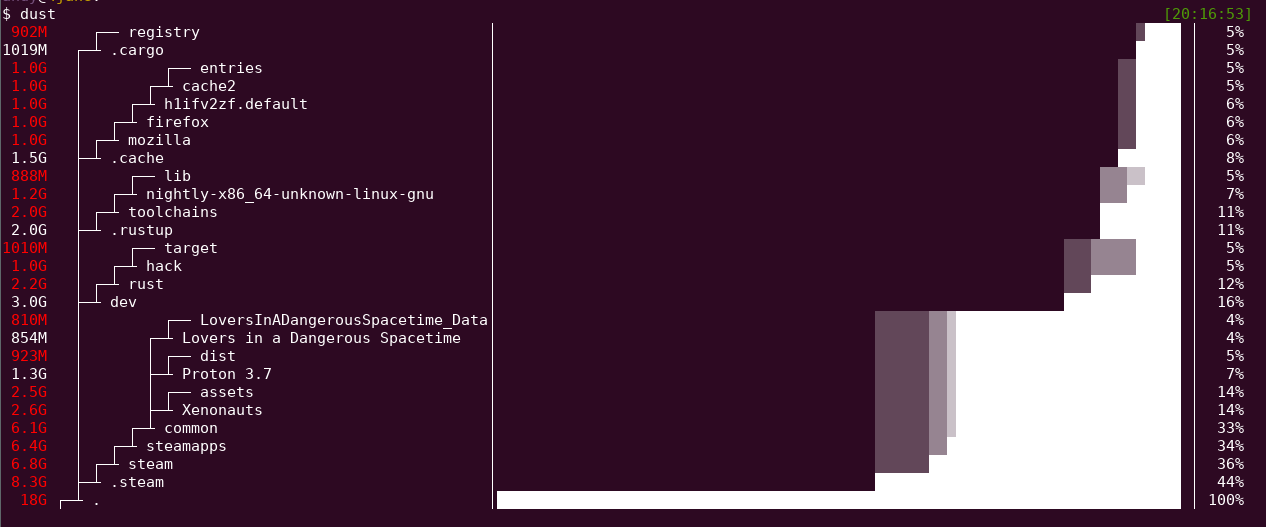
dust is a similar upgrade for the native du, showing a visual breakdown of disk space for the filesystem.
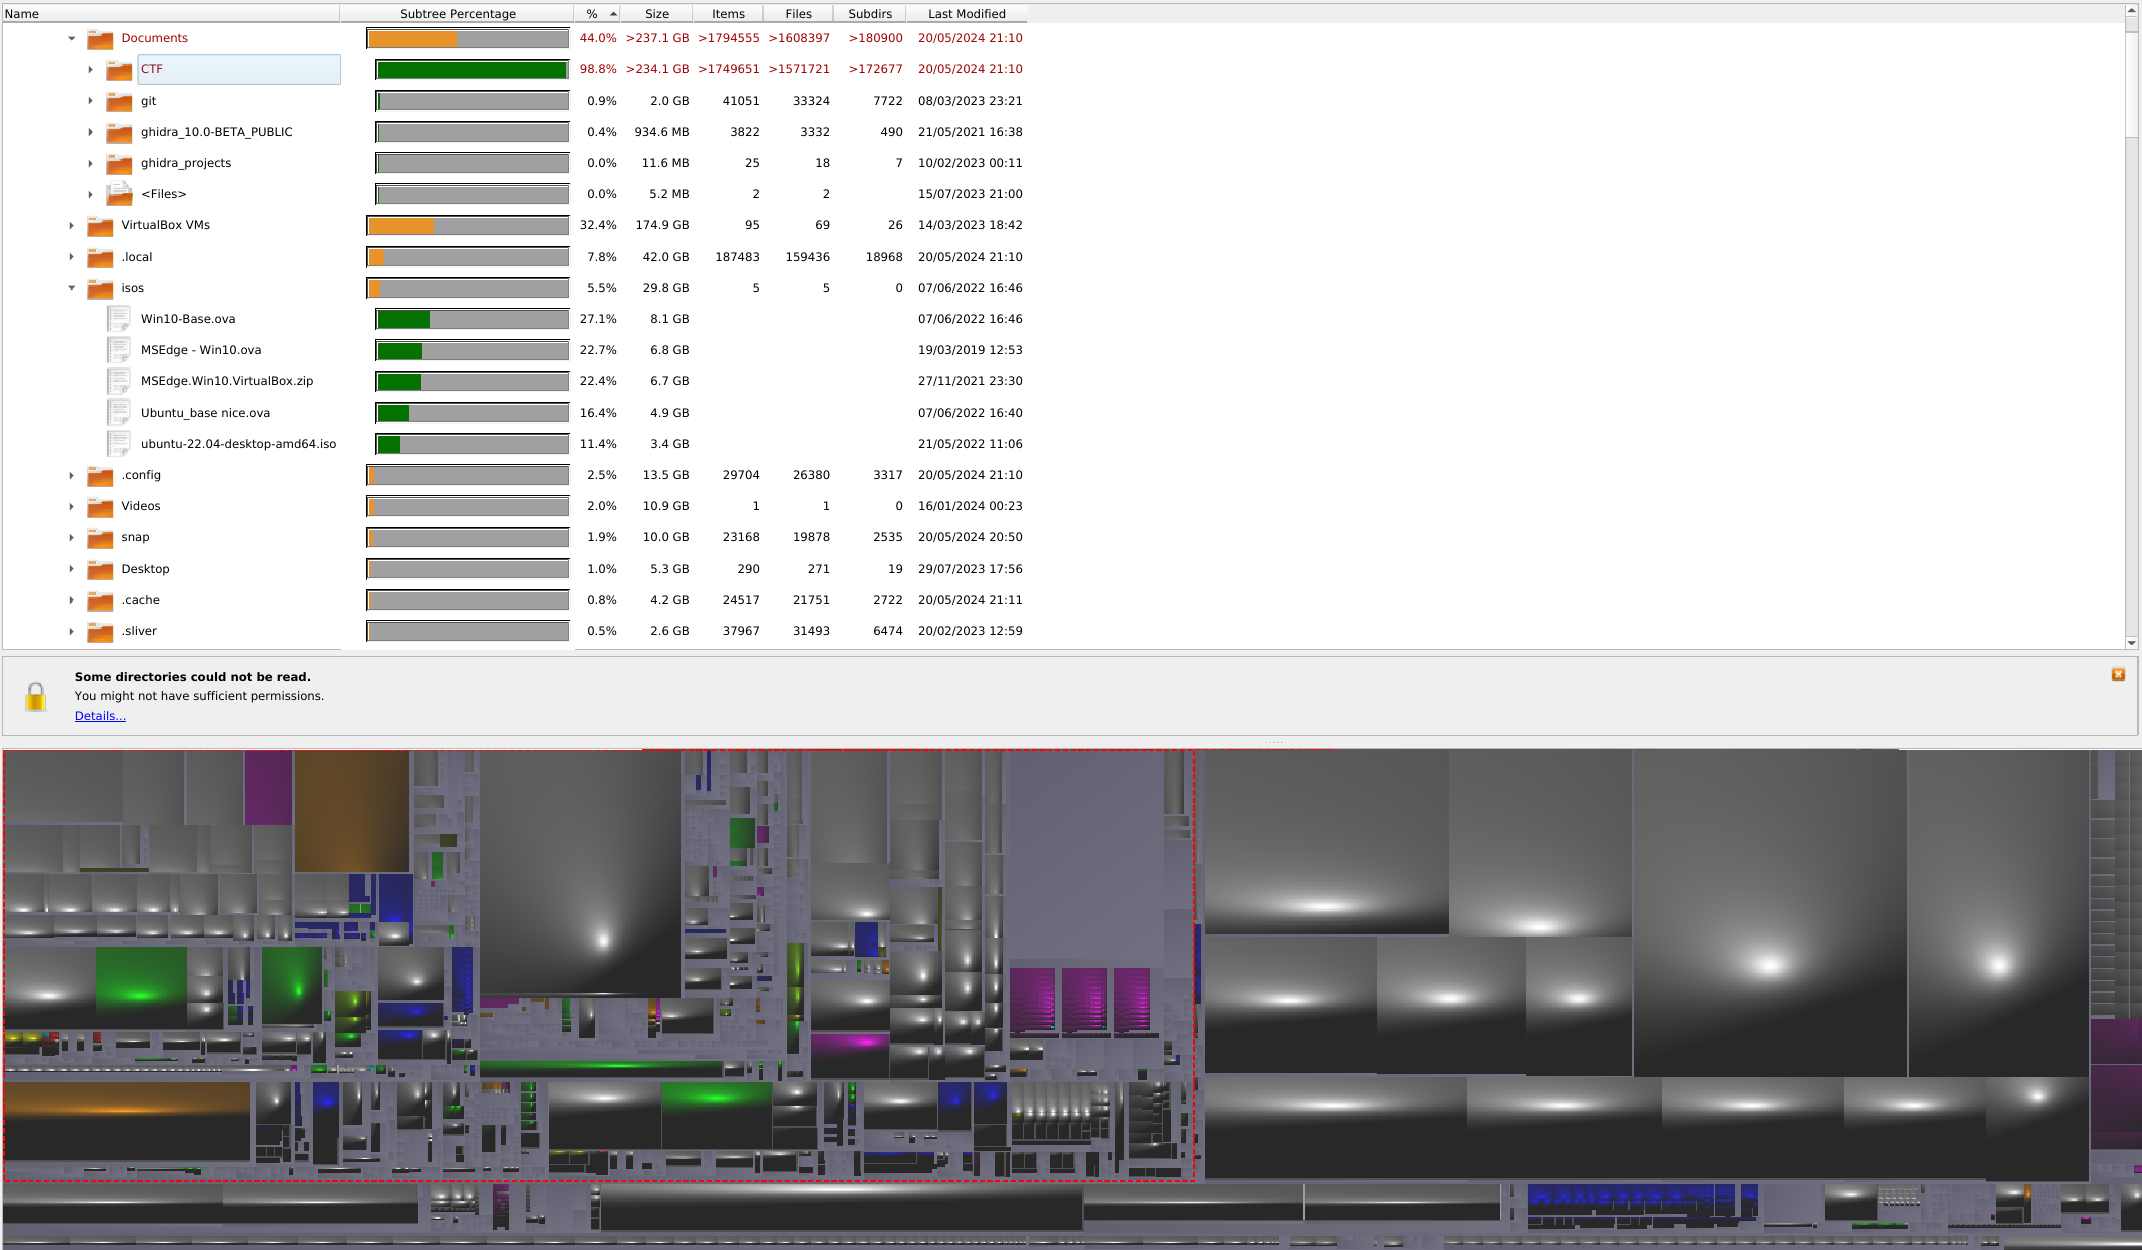
qdirstat is the only non-tui tool on this list, and is great for finding files to help free up disk space. It provides a tree based view of the filesystem, which allows you to quickly visualise which files are taking up too much space and prune them. By quickly jumping through the abnormally large items in the grid you can find files that could do with cleaning. In this image you can see several massive Virtualbox images, some downloaded ISOs and a 10GB john potfile.
Docker
ctop is a nifty view for running docker containers, also allowing you to interact with the containers via the TUI.
